IP Analysis
The IP analysis module keeps track of and displays information about requests and responses from ARP, RARP, DHCP, and DNS; and TCP sequence numbers, acknowledgement numbers, windows, and flags, as well as TCP and UDP port numbers.
Address Resolution Protocol (ARP) dynamically discovers the physical address of a device, given its IP address. Reverse Address Resolution Protocol (RARP) enables a device to discover its IP address by broadcasting a request on the network. Dynamic Host Configuration Protocol (DHCP) provides clients with a dynamically assigned IP address and other network configuration setting parameters. Domain Name System (DNS) is a set of distributed databases providing information such as the IP addresses corresponding to network device names, and the location of mail servers.
A Sequence number is a 32-bit field of a TCP header. If the segment contains data, the Sequence number is associated with the first octet of the data. TCP requires that data is acknowledged (given an Acknowledgement number) before it is considered to have been transmitted safely. TCP maintains its connections within a series of TCP windows established by the protocol. TCP packets may contain flags to denote a variety of conditions or protocol functions.
Results of the IP analysis module are displayed in the Summary column in the Packets view of any capture window, and its counts are used as some of the key baseline traffic elements provided in Summary Statistics.
To change the options for the IP analysis module:
1. On the menu, click, and then click .
2. Select IP Analysis Module and click . The IP Analysis Module Options dialog appears.
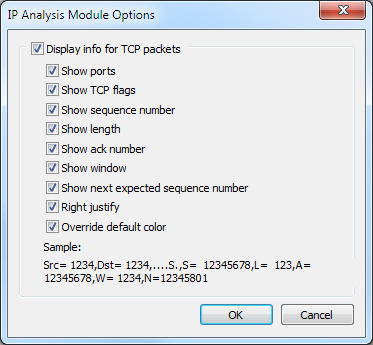
3. Options for this analysis module, all of which are enabled by default, are to show: ports, TCP flags, sequence number, length, ack number, window, and next expected sequence number. Also enabled by default are the display options of Right justify, which makes the numbers line up correctly when seen in the Packets view, and Override default color, which shows information from this analysis module in gray in the Summary column of the Packets view.